Over the years you learn a thing or two about equity markets. To state the facts, the Australian market does not go up in a straight line and is inherently less bullish than its bigger brother in the USA. There are a number of considerations to be made when looking at why this divergence occurs between the two markets and most notably it is that we are dominated by 2 sectors: Banks and Miners.
Miners, for all of their growth attributes, are cyclical stocks and their share prices are primarily driven by the underlying commodity that they produce. It shouldn’t be surprising to see that Fortescue (FMG.ASX) returned approximately 300% last year while price of Iron Ore tripled. The concern (or benefit depending on how you look at things) is that we could now be exposed to shorter cycles in the mining sector. Mum and Dad investors are now trading Crude Oil, Iron Ore, copper and other futures markets like never before. This is a direct result of the improvement of trading platforms globally and the glut of get rich quick trading courses available for a small outlay (compared to the potential profit you can make). While we don’t believe that the Iron Ore price is driven purely by traders it must surely come into consideration.
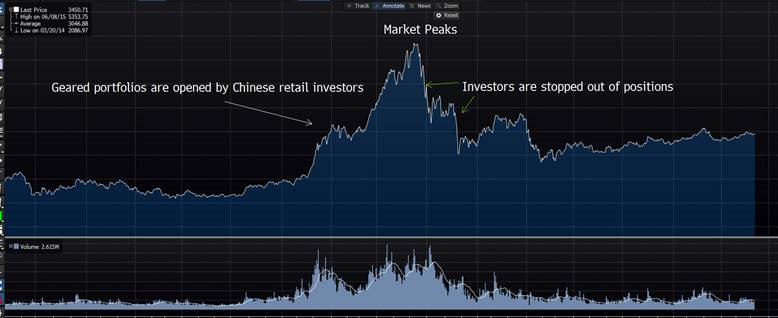
The Chinese market rallied by over 300% in six months and this coincided with an astonishing rate of retail traders opening up leveraged accounts. It was no surprise that the market fell just as quickly and found itself back to where it started a year later.
As the expression goes: Up the escalator, down the elevator…
The moves in Iron Ore have been so significant that companies on the verge of defaulting just twelve months ago are now forecasting profitable years while reducing their debt (AGO.ASX, BCI.ASX). Surely a high risk game for those with the requisite stomach…
If we are now in a period of shorter cycles there is a very real possibility that one third of our market (the Miners) has now peaked. To see Iron Ore above $100 USD this year seemed extremely unlikely, so in the same breath is it possible to start talking about Iron ore below $50 this year? Of course it is.
So what are the signals?
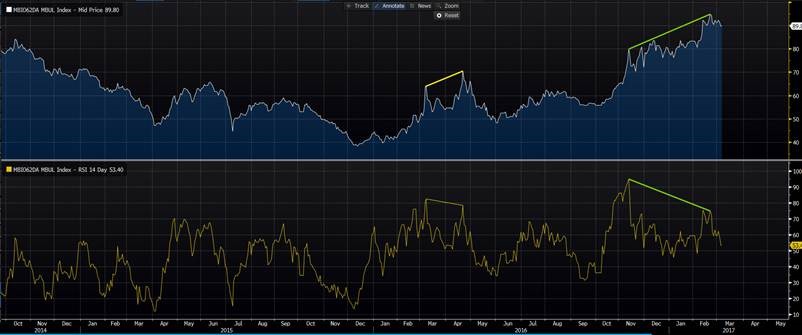
By taking a closer look at the price of Iron Ore we can see that it is currently trading at yearly highs, but the strength of the buying is becoming weaker. This is shown in the RSI (relative strength index) on the second panel below. This should ring alarm bells for investors looking to buy assets with exposure to Iron Ore as it suggests that the current cycle could be over and it could happen quickly.
The bigger they are the harder they fall….
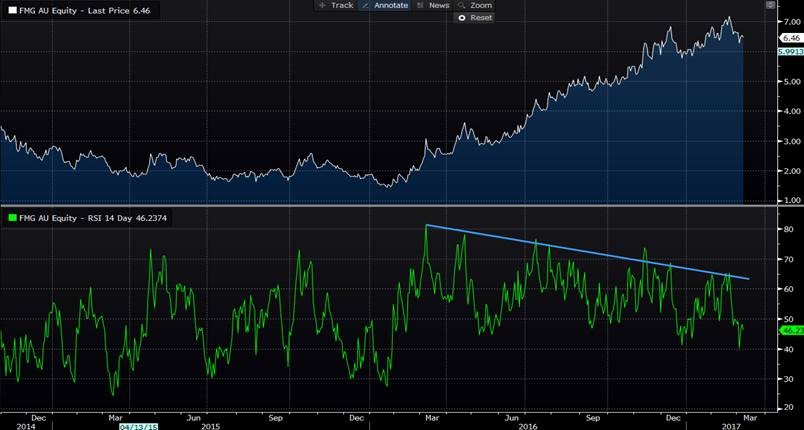
Exhibit B: Fortescue – Price is up but RSI is lower…
Reaction Time & Volatility
Add this weakening strength to the fact that markets move quicker today than they ever have. For example, when Donald Trump was elected the market fell by 800 points and then rallied by 800 points a few hours later. It was classic market psychology playing out over a compressed period of time. Earlier that year, Brexit took three days to recover compared to Trump’s three hours. Fear followed by more fear followed by FOMO followed by greed.
All in the space of a few hours.
It is important to understand that this was a unique event (for obvious reasons) but it highlights the dramatic swing from one point of view to the opposing point of view in a very short period of time.
The Australian market is currently experiencing a period of low volatility.
Low volatility typically corresponds with higher share markets and higher confidence among investors. The concern here is that we know this will come to an end. While we cannot be exact on when this will happen there are clear signs in the materials sector that the new shorter term cycle is coming to an end.
If this is the case we shouldn’t expect to see 6000 points on our local index in the short term.
Below we can see how extended periods of low volatility are followed by falls in equity markets of close to 10%. With a historical mean of 15%, volatility in the ASX 200 is now trading well below those levels at 12%.
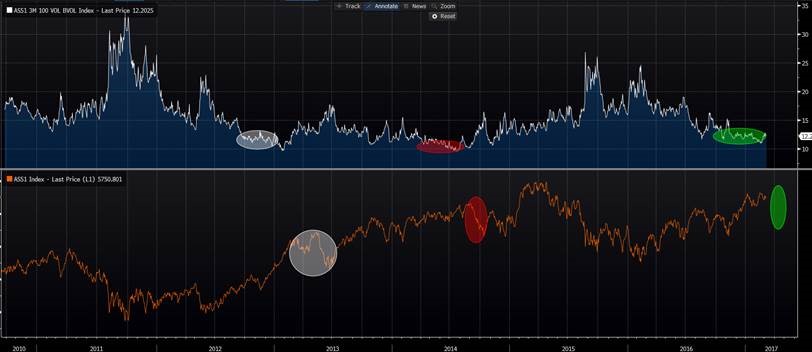
ASX 200 volatility highlighted (top chart) with price drops (bottom chart)
We’ve highlighted three places. If you look closely we’re sure you’ll find more.
We’re in no way making a call for a buy or a sell of this market at its current location. We’ve seen markets go up from here as much as we’ve seen them go down. We do, however, offer some food for thought on the ongoing low volatility, combined with shorter cycles and the clear lack of strength behind current prices.
All the best,
Martin Woods,
Portfolio Manager
VFS Group Investment Committee
All images courtesy Bloomberg
Disclaimer:
This Communication has been prepared by Vertical Capital Markets Pty Ltd (ABN 11 147 186 114 AFS Licence No. 418418) trading as VFS Group (VFS Group).
This Communication is for general information purposes only. It does not take into account your investment objectives, financial situation or particular needs. Before making an investment decision on the basis of the information contained in this report, you should consider whether the information is appropriate in light of your particular investment objectives, financial situation or particular needs. You may wish to consult an appropriately qualified professional to advise you. Derivatives can be highly leveraged, carry a high level of risk and are not suitable for all investors. Investors should only invest in such products if they have experience in derivatives and understand the associated risks.
VFS Group and/or entities and persons connected with it may have an interest in the securities the subject of the recommendations set out in this report. In addition, VFS Group and/or its agents will receive brokerage on any transaction involving the relevant securities or derivatives.
If you receive this Communication in error, please immediately delete it and all copies of it from your system, destroy any hard copies of it and notify the sender. If you are not the intended recipient, you must not disclose the information contained in this Communication in any way.