
According to ancient investment legend, “Sell in May & go away” now gives way to the “June swoon” and we reiterate that if you’re making investment decisions based on rhymes you need to rethink your strategy.
However the banks certainly took a tumble in May and we were right there riding the wave down.
Firstly, our own Kieran Neeson was assisting our close friends at TradeFloor (about the 19 minute mark) to construct some options strategies for their audience & put together a Calendar Bear Put Spread that later went out to clients in the middle of April. Simply explained, this was a buy of a put (predicting CBA to drop) along with the sale of a longer dated put to help offset the cost and lessen the risk of the strategy.
In the three weeks we held the strategy CBA dropped 5% and the position doubled in value to be closed on Budget Tuesday as news started to filter through that the Government was set to impose a tax on the Big 4 banks.
A good trade, well managed and delivering a good profit for clients.
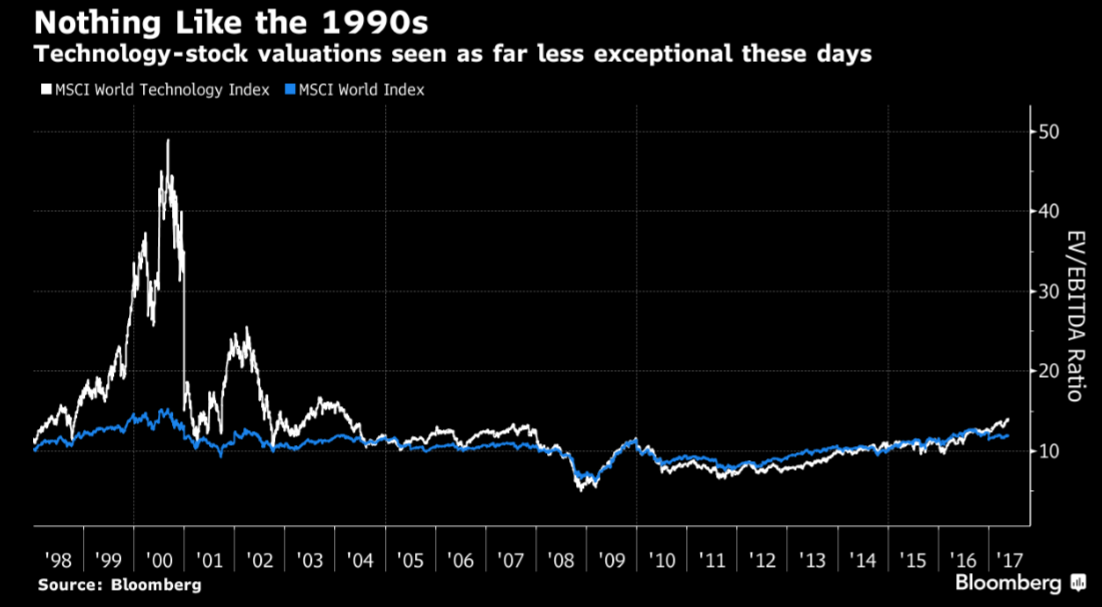
Enterprise value (EV) to EBITDA of the MSCI World Tech Index (White Line) vs the MSCI World Index (Blue line) Courtesy Bloomberg
Aside from the local (and US) bank selloff we are in the midst of a US tech rally which we have managed to capture somewhat. The above chart is a response to those saying the recent tech rally in the US market looks like a repeat of the late 90s/2000 lead up to the “Tech Wreck”. It shows the EV (market cap less cash*) as a ratio of a company’s earnings**.
Note the gap between tech stocks (white) and “the world” (blue) back in 2000 and compare it to today. The gap is virtually non-existent compared to the bubble of 17 years ago. Say what you will about the cost of money vs 1999 and its impact on company debt & expenditure but at this basic level companies in the tech space are actually making money, compared to 2000 when they weren’t. There’s obviously more to every story but at this most basic level the tech space is far more investable today than at the end of the last century.
However as we all know every story has a twist in the tail, we will, as always, endeavor to be ahead of the curve.
*Put simply
**Put really, really simply
All the best,
James Whelan & the VFS Investment Committee
Level 30 Australia Square, 264 George Street, Sydney NSW 2000
+1300 220 360 | www.vfsgroup.com.au
Disclaimer:
This Communication has been prepared by Vertical Capital Markets Pty Ltd (ABN 11 147 186 114 AFS Licence No. 418418) trading as VFS Group (VFS Group).
This Communication is for general information purposes only. It does not take into account your investment objectives, financial situation or particular needs. Before making an investment decision on the basis of the information contained in this report, you should consider whether the information is appropriate in light of your particular investment objectives, financial situation or particular needs. You may wish to consult an appropriately qualified professional to advise you. Derivatives can be highly leveraged, carry a high level of risk and are not suitable for all investors. Investors should only invest in such products if they have experience in derivatives and understand the associated risks.
VFS Group and/or entities and persons connected with it may have an interest in the securities the subject of the recommendations set out in this report. In addition, VFS Group and/or its agents will receive brokerage on any transaction involving the relevant securities or derivatives.
If you receive this Communication in error, please immediately delete it and all copies of it from your system, destroy any hard copies of it and notify the sender. If you are not the intended recipient, you must not disclose the information contained in this Communication in any way.